Mineral Network Analysis
I. The Initial Idea for Mineral Network Analysis (June 7-9, 2016)
June 7 to 9, 2016, our Keck-sponsored Deep-Time Data Consortium held a workshop at RPI to consider various approaches to visualizing data in mineralogy and paleobiology. Attendees included Peter Fox, Congrui Li, Marshall Ma, Ahmed Eleish, Anirudh Prabhu (RPI); Joshua Golden, Shaunna Morrison, Alex Pires, Bob Downs (University of Arizona); Ben Jelen, Eli Moore (Rutgers); Jihua Hao (Johns Hopkins); Chao Liu, Dan Hummer, Bob Hazen (Carnegie).
While considering various visualization options, including chord diagrams, Klee diagrams, and cluster analysis, we realized that the distribution of minerals in rocks and ore deposits could be represented by network diagrams, which are commonly employed in social network analysis to represent such diverse situations as the Facebook friends, the spread of disease, research collaborations, and terrorist networks.
For an introduction to network analysis see this Deep Carbon Observatory webinar by Ahmed Eleish and Shaunna Morrison.
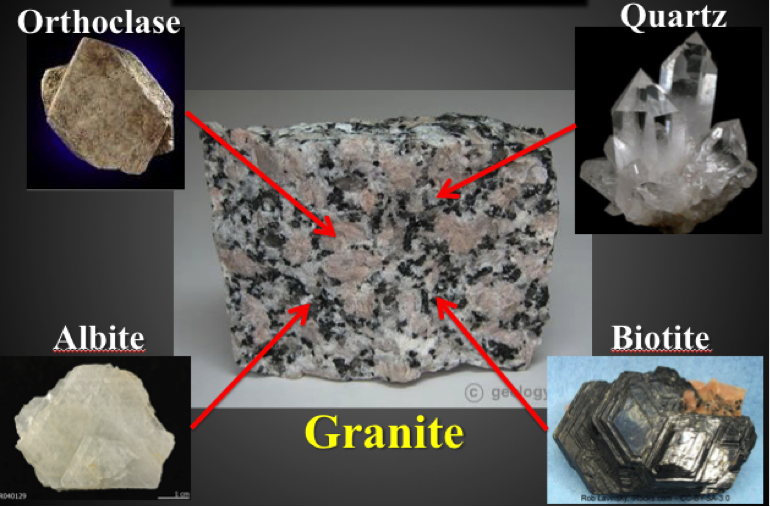
Hazen generated a simple list of coexisting minerals in igneous rocks (such as granite and basalt; Figure 1) by collating about 90 rocks with 37 different minerals illustrated in Alfred Harker’s classic Petrology for Students (Cambridge University Press, 1964 edition).
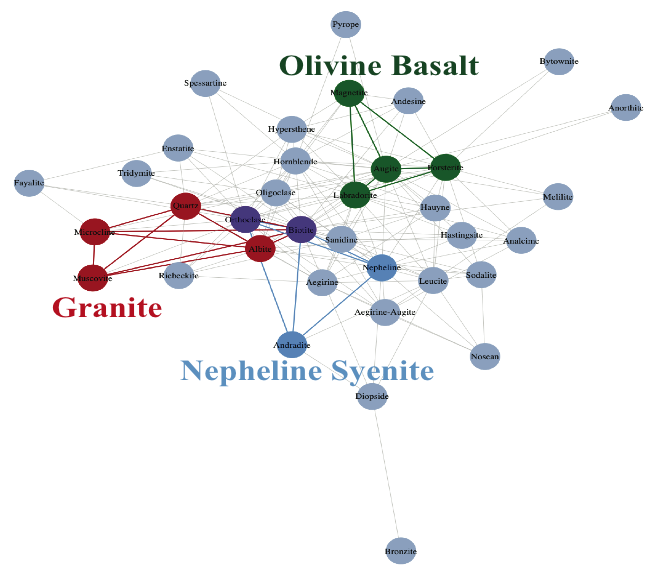
The initial network renderings were made by RPI colleagues Ahmed Eleish, Anirudh Prabhu, and Congrui Li. The resulting relationships among minerals were represented by the following simple network (Figure 2), in which every common type of igneous rock is present as a group of connected minerals.
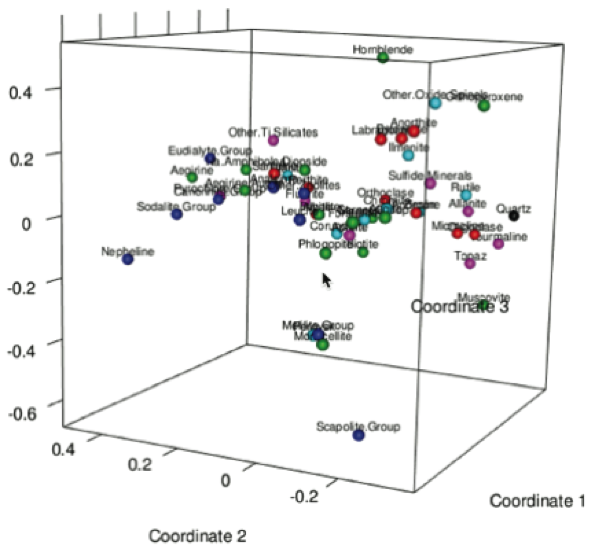
This graph was followed by many more using different data resources and renderings. For example, we tried multi-dimensional scaling of 51 igneous minerals in more than 700 igneous rocks (Figure 3), as described in the much more comprehensive 4-volume Petrography of Albert Johannsen (University of Chicago Press, 1932-1938). We did two versions, the first a 3-D rendering.
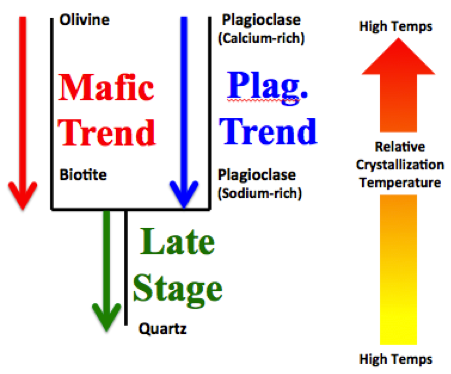
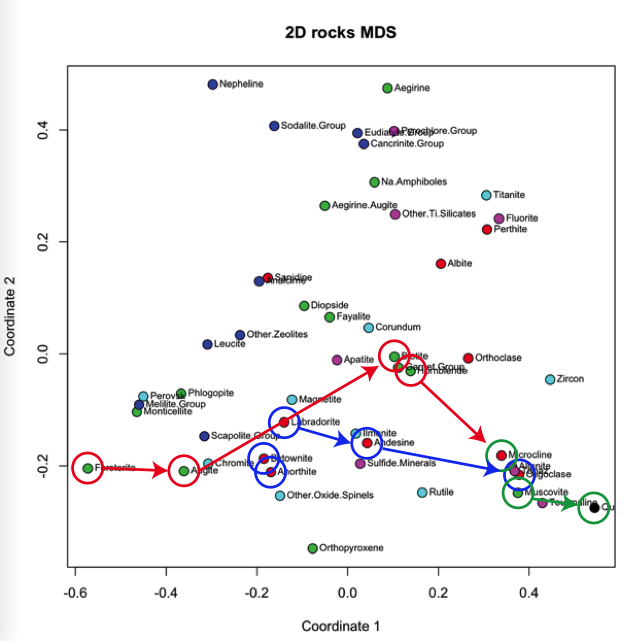
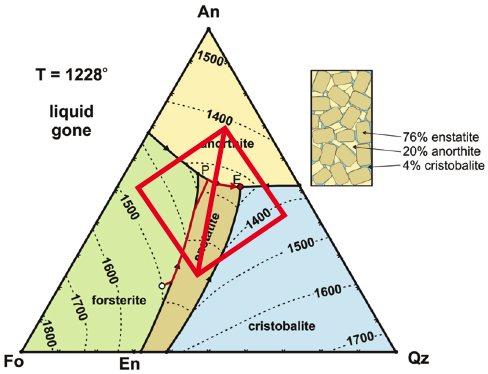
The team also generated a 2-D version (Figure 5). As with other networks, the distances between nodes indicates how commonly two minerals occur together—the closer together, the more common they are found together in igneous rocks. The 2-D graphs embed many features familiar to igneous petrologists, including Bowen’s reaction series (Figures 4 and 5) and phase diagrams (Figure 6).
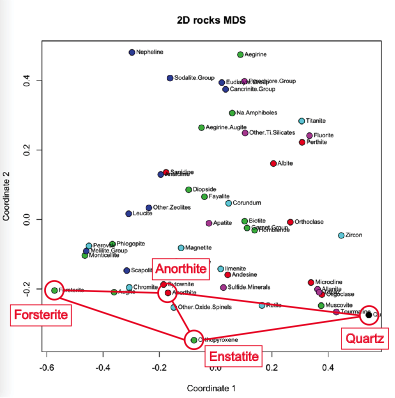
Among the most revealing of mineral network diagrams are force-directed graphs, such as the example of igneous rock-forming minerals (Figure 7), which employs the same data compilation as used in Figures 3, 5, and 6.

We also created force-directed networks of chromium minerals (Figure 8; data compiled by Chao Liu) and copper minerals (Figure 9; data compiled by Shaunna Morrison).


An important finding is the strong degree of clustering in mineral networks according to paragenetic modes, composition, age, and other parameters. These findings suggest that mineral networks and the data underlying them have the potential to reveal insights about mineral diversity and distribution.
In later studies we applied bipartite network diagrams to data on minerals and their localities. Bipartite renderings combine nodes for mineral species with nodes for their localities. Additional mineralogical parameters can be represented, for example by altering the colors, sizes, and shapes of mineral nodes to reveal composition, paragenetic mode, age, or hardness. Similarly, the locality nodes can be modified to represent tectonic setting, mineral diversity, or other characteristics.


The colors represent the age of first appearance of each mineral species and the sizes represent mineral abundances (common minerals have bigger circles). Mineral species are linked by lines to more than 300 localities worldwide (black circles); the size of the black circles indicate how many carbon-bearing minerals occur at that locality. A vast amount of information is represented in this interactive visualization.

This network diagram also illustrates 400 carbon-bearing minerals (colored circles) with the same topology as Figure 11. However, the colors here represent the abundances of each mineral species, which highlights the concentration of common species in the core of the "U-shaped" distribution of black locality nodes. Note that rarer minerals tend to form a "halo" around the edges of the network.
II. Mineral Network Analysis Lectures: 2016-2017
The concept of mineral network analysis was first presented at the 2016 Roebling Medal Symposium at the Annual Meeting of the Geological Society of America, September 29, 2016 in Denver, Colorado. Many of our advances, including mineral network analysis, were presented at an all-day symposium at which many of us participated. My Roebling Lecture on “The co-evolution of Earth and life: Insights from big data mineralogy” showed the dynamic nature of networks.
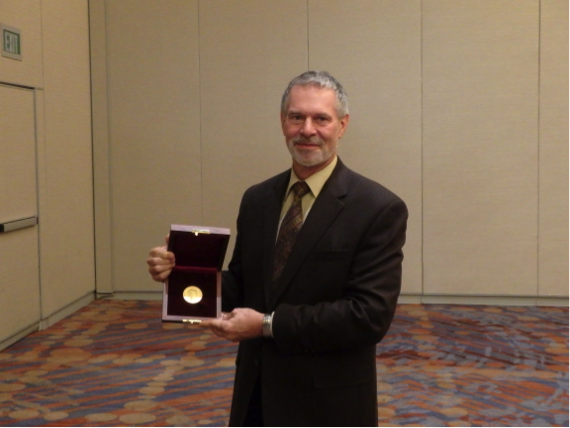
September 29, 2016: “MSA Roebling Medal Lecture: The co-evolution of Earth and life; insights from big data mineralogy.” R.M. Hazen and the Keck DTDI Collaboration, Geological Society of America Annual Meeting, Denver, CO.
September 29, 2016: “Quantifying and visualizing Earth’s mineral chemistry through geologic time.” D.R. Hummer, R.M. Hazen, et al., Geological Society of America Annual Meeting, Denver, CO.
September 29, 2016: “Mineral ecology: Social network analysis and sociograms of mineral connections, distributions, and segmentation.” S.M. Morrison, R.M. Hazen, et al., Geological Society of America Annual Meeting, Denver, CO.
September 29, 2016: “Social network of copper minerals: A mineral ecology study.” S.M. Morrison, R.M. Hazen, et al., Geological Society of America Annual Meeting, Denver, CO.
September 29, 2016: “The co-evolution of the geo- and biospheres: An integrated program for data-driven, abductive discovery in the Earth sciences.” M. Meyer, R.M. Hazen, et al., Geological Society of America Annual Meeting, Denver, CO.
November 15, 2016: “Private lives of minerals.” Carnegie Institution for Science, Washington, DC.
November 30, 2016: “Coevolution of the geosphere and biosphere.” Keck Foundation, Los Angeles, CA.
December 15, 2016: “Private lives of minerals: Social network analysis applied to mineralogy and petrology.” R.M. Hazen et al., American Geophysical Union Annual Meeting, San Francisco, CA.
December 15, 2016: “Big data mineralogy: Applications to the diversity, distribution, and social networks of copper minerals.” S.M. Morrison, R.M. Hazen, et al., American Geophysical Union Annual Meeting, San Francisco, CA.
February 16, 2017: “The private lives of minerals.” Geophysical Laboratory Support Staff “Third Thursday” Lecture, Washington, DC.
February 23, 2017: “Private lives of minerals: network analysis of rocks and minerals.” Syracuse University, Chauncey Holmes Lecture.
March 23, 2017: “Network analysis applications to carbon mineral systems.” With S.M. Morrison, A. Eleish, D. Hummer, and R.M. Hazen. Deep Carbon Observatory Science Meeting, St. Andrews, Scotland.
March 25, 2017: “Network analysis applications to carbon mineral systems.” S.M. Morrison, R.M. Hazen, et al. Deep Carbon Observatory Science Meeting, St. Andrews, Scotland.
March 25, 2017: “Copper mineral ecology and network analysis through deep time.” S.M. Morrison, R.M. Hazen, et al. Deep Carbon Observatory Science Meeting, St. Andrews, Scotland.
March 25, 2017: “The Carbon Mineral Challenge: A worldwide search for undiscovered minerals.” D.R. Hummer, R.M. Hazen, et al. Deep Carbon Observatory Science Meeting, St. Andrews, Scotland.
April 5, 2017: “Mineral evolution in the era of “big-data” mineralogy.” Austrian Academy of Sciences, Vienna.
April 24, 2017: “Minerals and the origins of life: Insights from big data mineralogy.” Astrobiology Science Conference 2017, Mesa, Arizona.
April 24, 2017: “Mineral network analysis applications in comparative planetology.” With Morrison et al., Astrobiology Science Conference 2017, Mesa, Arizona.
April 25, 2017: “Deep-time Data Infrastructure: Visualizing the Co-Evolution of Planets and Life.” With Michael Meyer et al., Astrobiology Science Conference 2017, Mesa, Arizona.
May 8, 2017: “Deep-Time Evolution of Rocks and Life”. Covington Law Office, Washington DC.
III. The First Paper (American Mineralogist, v.102)
Morrison SM, Liu C, Eleish A, Prabhu A, Li C, Ralph J, Downs RT, Golden JJ, Fox P, Hummer DR, Meyer MB and Hazen RM (2017) Network analysis of mineralogical systems. American Mineralogist, 102(8):1588-1596
Abstract: A fundamental goal of mineralogy and petrology is the deep understanding of mineral phase relationships and the consequent spatial and temporal patterns of mineral coexistence in rocks, ore bodies, sediments, meteorites, and other natural polycrystalline materials. The multi-dimensional chemical complexity of such mineral assemblages has traditionally led to experimental and theoretical consideration of 2-, 3-, or n-component systems that represent simplified approximations of natural systems. Network analysis provides a dynamic, quantitative, and predictive visualization framework for employing “big data” to explore complex and otherwise hidden higher-dimensional patterns of diversity and distribution in such mineral systems. We introduce and explore applications of mineral network analysis, in which mineral species are represented by nodes, while coexistence of minerals is indicated by lines between nodes. This approach provides a dynamic visualization platform for higher-dimensional analysis of phase relationships, because topologies of equilibrium phase assemblages and pathways of mineral reaction series are embedded within the networks. Mineral networks also facilitate quantitative comparison of lithologies from different planets and moons, the analysis of coexistence patterns simultaneously among hundreds of mineral species and their localities, the exploration of varied paragenetic modes of mineral groups, and investigation of changing patterns of mineral occurrence through deep time. Mineral network analysis, furthermore, represents an effective visual approach to teaching and learning in mineralogy and petrology.

